
AI genogram maker · text to family diagram
Genogram Maker
Type who is in the family, how they are related and what matters about them. The genogram maker turns those notes into a clean genogram image with standard symbols and a legend.
A genogram is a family diagram that shows at least three generations, marriages and divorces, health history and emotional bonds. Instead of dragging shapes in a diagram editor, use this AI genogram maker as an automatic genogram generator: it reads your description and draws the chart for you in clinical, color-coded, hand-drawn or kid-friendly style.
Example genogram
Clinical
AI sample of the sample family (ChatGPT image model) · your result will differ
Genogram examples: one family, four genogram maker styles
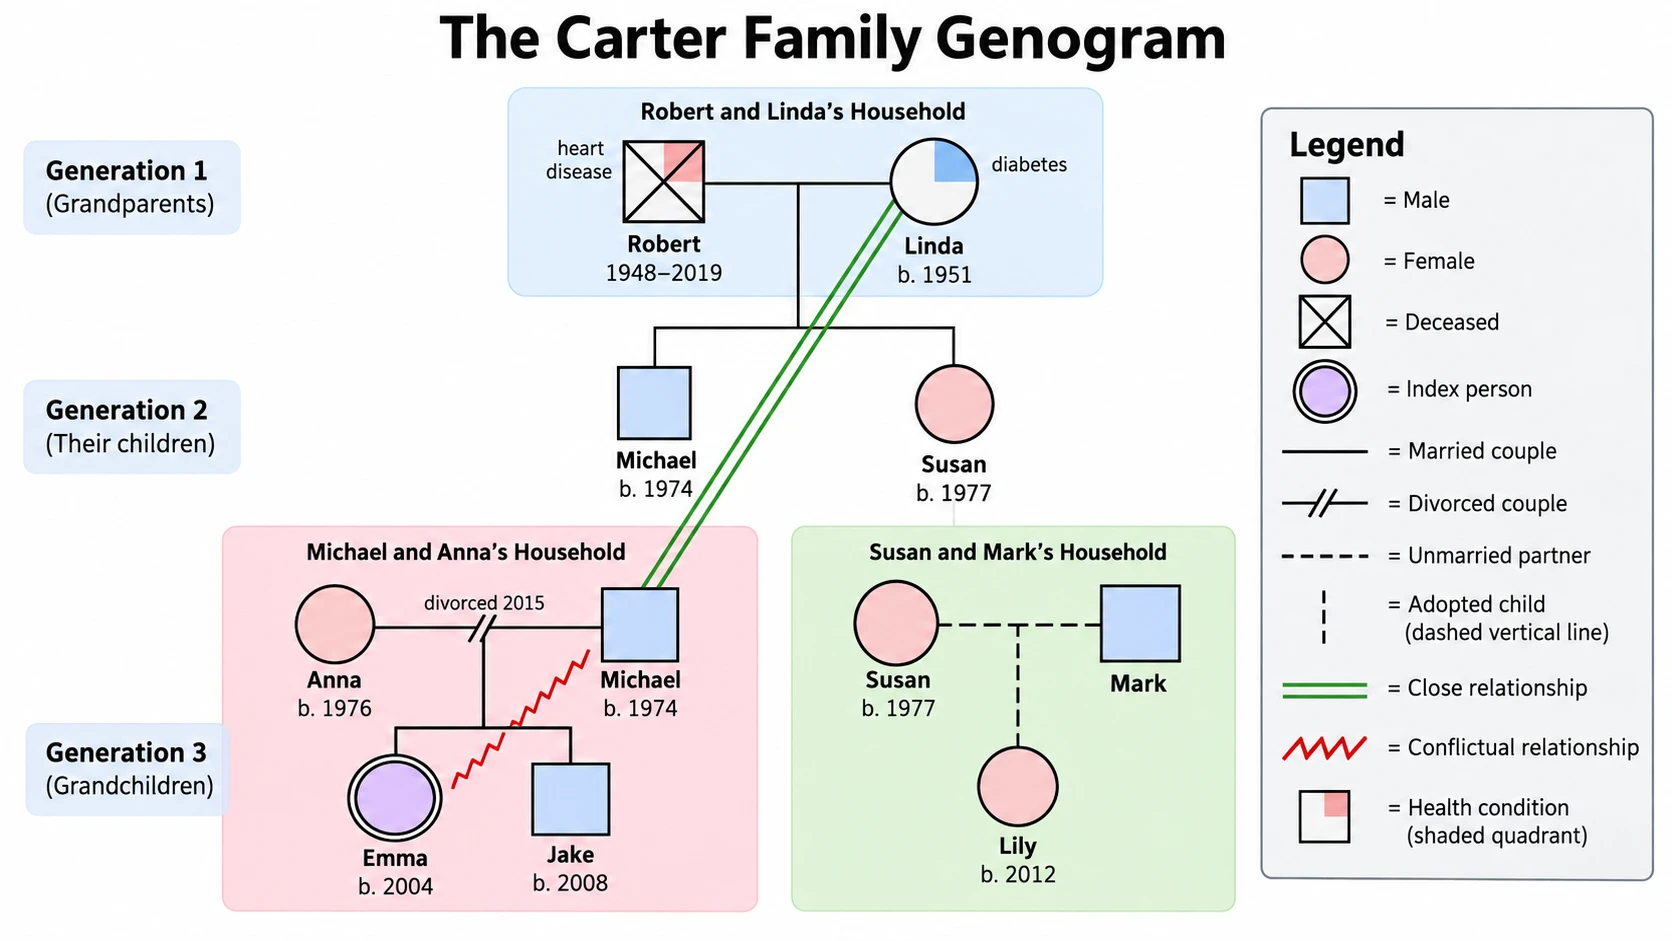
Each family genogram example below is a family genogram with 3 generations drawn from the same description, so you can compare the four styles side by side. Load this sample family genogram into the family genogram maker with one click, or use it as a family genogram template and replace the names with your own.
Clinical
Black lines on white, neutral labels and a compact legend. The safest choice for nursing, social work and counseling assignments.
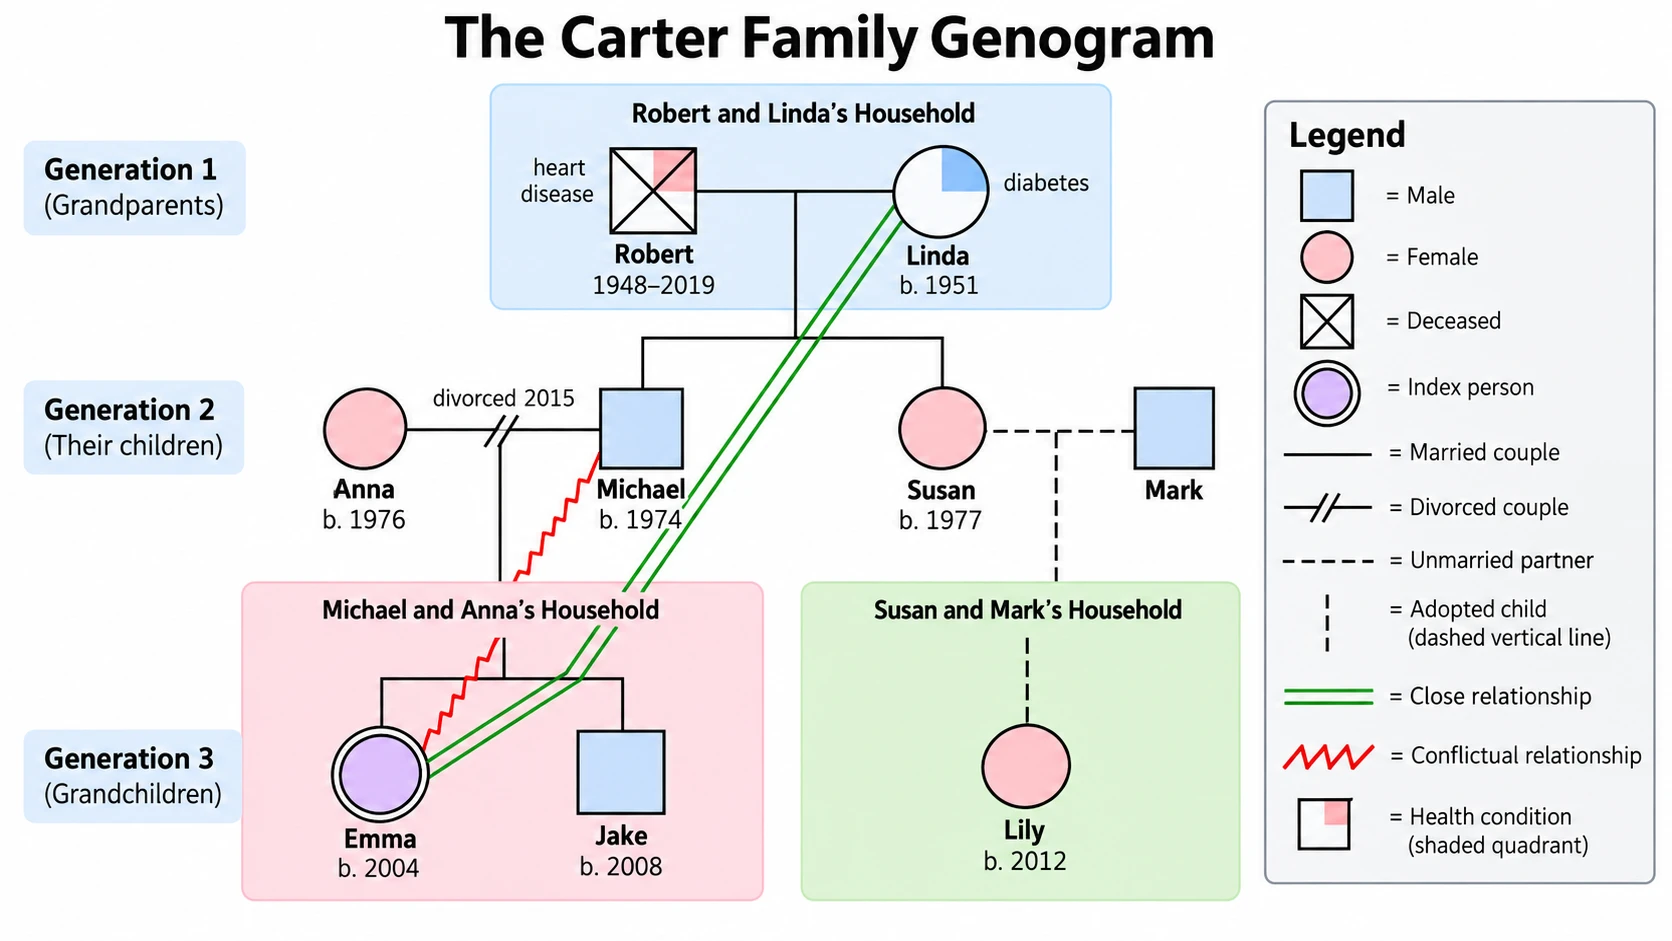
Color-coded
Soft fills, green close lines, red conflict lines and shaded health conditions. Patterns across generations stand out at a glance.
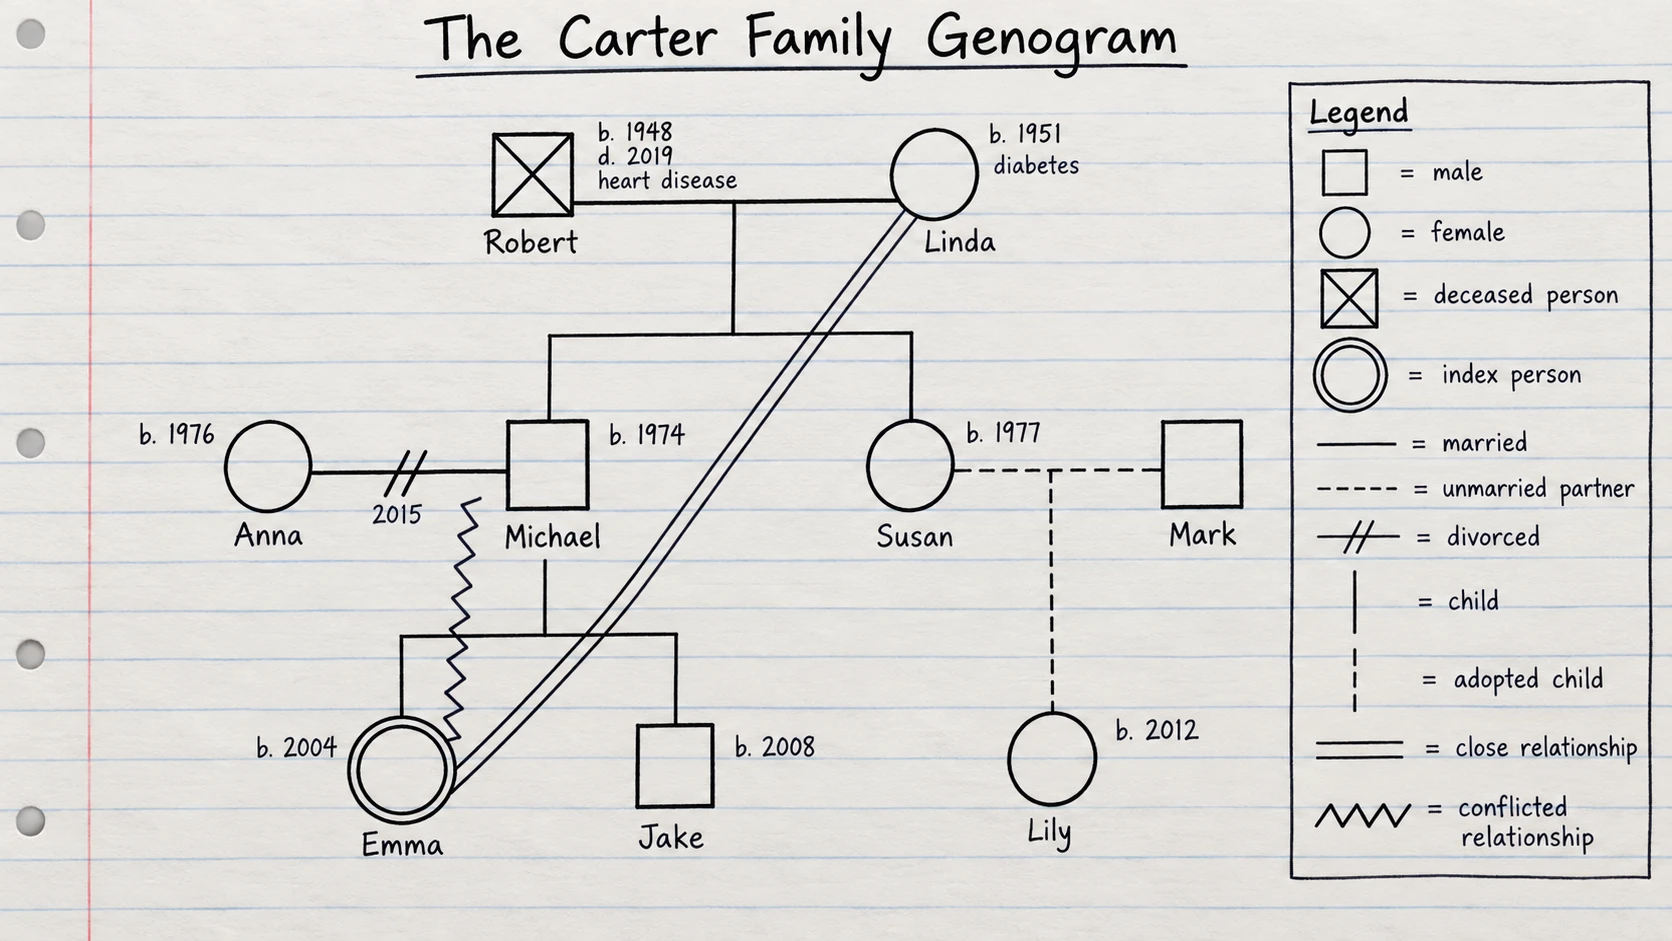
Hand-drawn
A genogram hand drawn on notebook paper. Useful for reflective journals, presentations and worksheets that should feel personal.
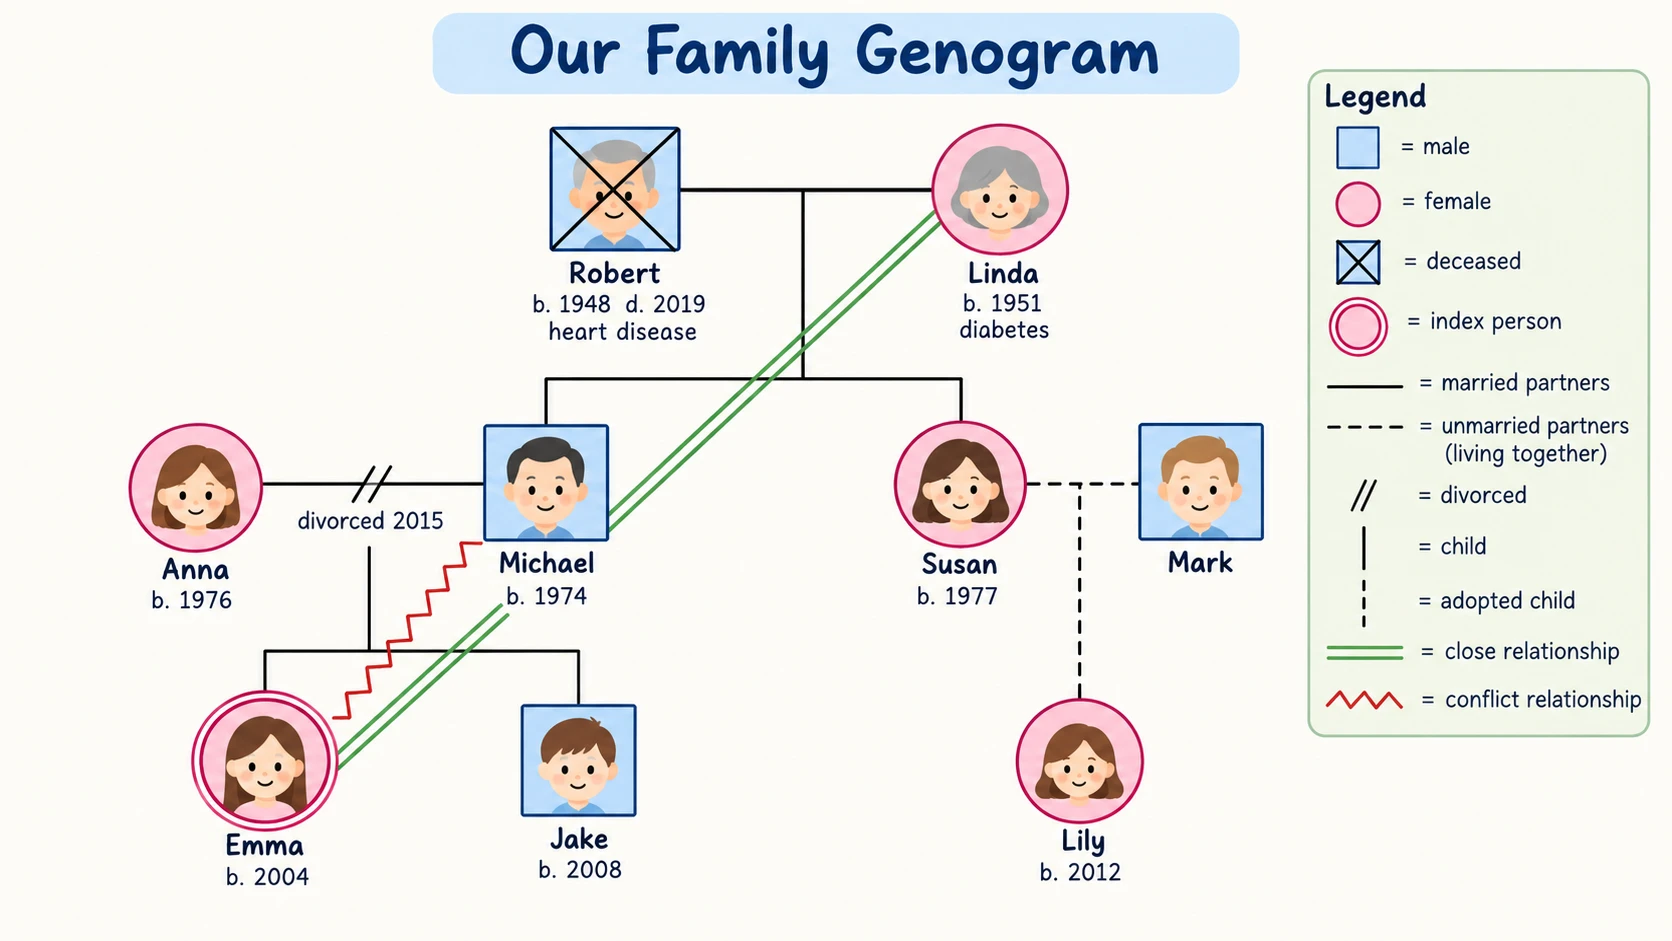
Illustrated
Pastel shapes with friendly faces and room for pets. A family genogram for kids, school projects and family therapy with children.
All four genogram examples are real AI samples generated in October 2026 from the sample description and the same prompt this genogram maker builds. They were made with ChatGPT’s image model, and the color-coded one needed one correction round, so your layout and details will differ.
How the description becomes symbols
- “Robert (born 1948, died 2019, heart disease)” → a square with an X, both years, and the condition written beside it or shaded inside the symbol.
- “married Linda” → a solid line joining the couple, with their children hanging below, oldest on the left.
- “they divorced in 2015” → two slashes across Michael and Anna’s couple line.
- “Susan lives with her partner Mark (not married)” → a dashed couple line.
- “adopted a daughter, Lily” → a dashed line from the couple down to Lily.
- “Emma (index person)… close to Linda… conflicted relationship with Michael” → a double outline for Emma, two parallel lines to Linda and a zigzag line to Michael.
How to make a genogram with the genogram maker
- 1
Describe the family
To make your own genogram online, write each person once with a name, gender and birth year, then add marriages, divorces, children, deaths, conditions and close or conflicted relationships. Short sentences work best in this genogram creator.
- 2
Choose a style and layout
Pick clinical, color-coded, hand-drawn or illustrated, a landscape or portrait ratio, an optional title and whether to include a legend.
- 3
Generate, check and download
The online genogram maker returns a PNG, usually within one to two minutes: 1K on Fast, 2K on HD and Studio, 4K on Ultra HD. Check every name and line against your notes, then download it or regenerate with a clearer description.
Wondering how to draw a genogram by hand instead? Start with the oldest couple on the top row, add each generation on its own row, then draw marriage lines, child lines and relationship lines in that order. The genogram maker follows the same order automatically.
Genogram symbols the genogram maker follows
Every style uses widely taught McGoldrick-style conventions, so a teacher or supervisor can read your chart without a custom key. The genogram key, or legend, on each image explains only the symbols that appear in it.
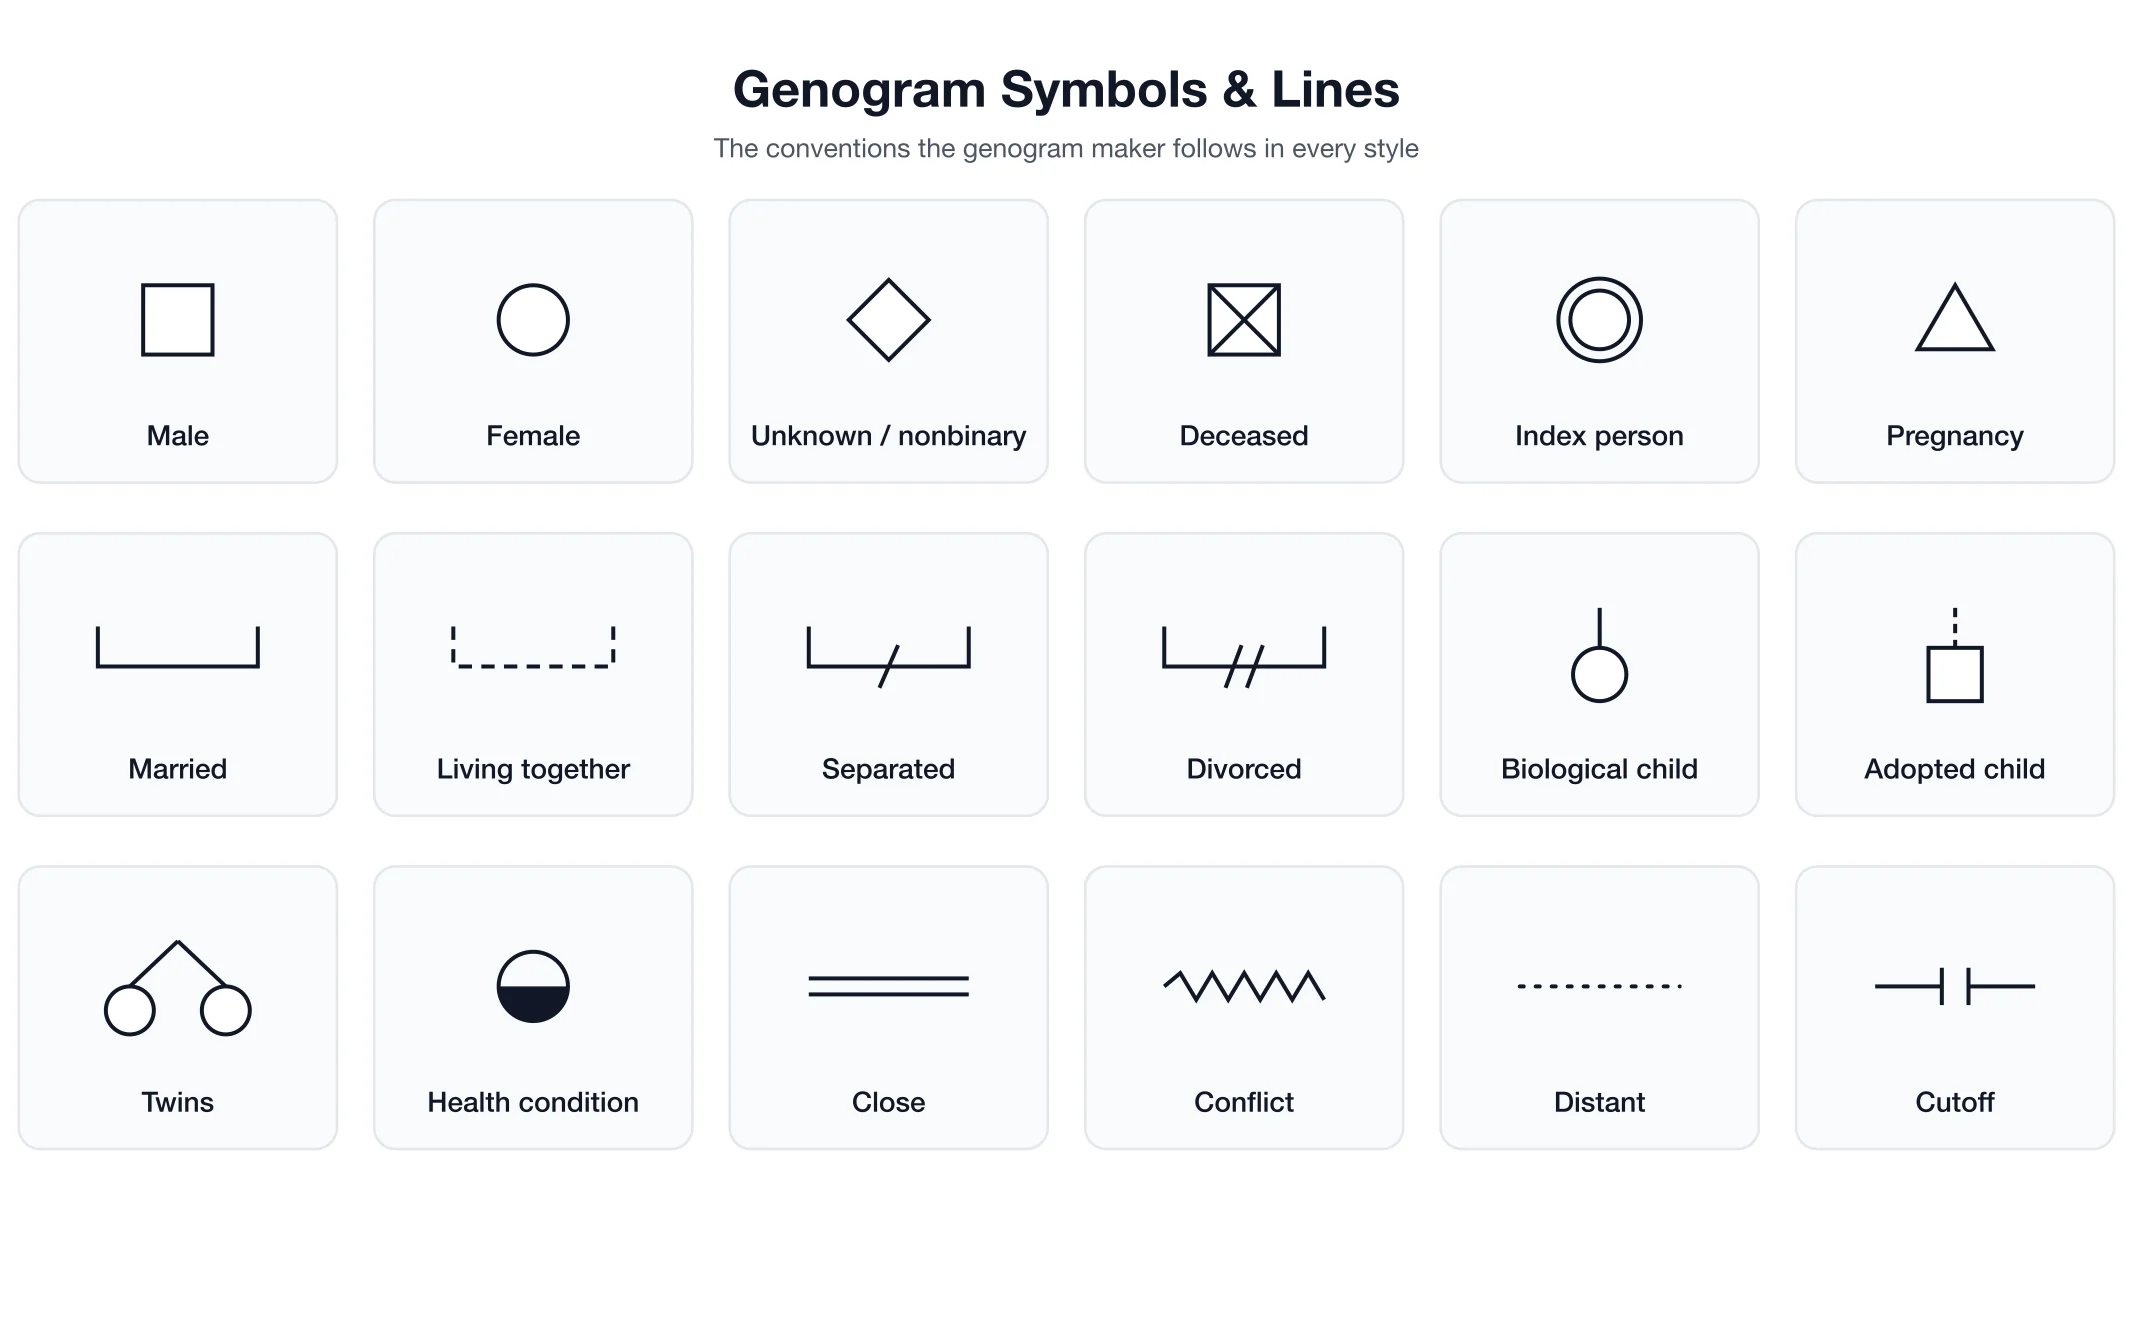
Squares are males, circles are females and a diamond marks a person whose gender is unknown or nonbinary. An X means the person has died, and a double outline marks the index person, the person the genogram is about. Partner lines are solid for marriage and dashed for living together; one slash means separated and two slashes mean divorced. Children hang from the couple line, adopted children use a dashed line, and twins share one point. Emotional lines are drawn only when you describe them: parallel lines for close, a zigzag for conflict, dots for distant and a broken line for a cutoff. A triangle marks a pregnancy, and shading inside a symbol marks a health condition.
How to describe your family for an accurate family genogram
The genogram maker draws exactly what you write and does not guess missing relatives. A clear description is the biggest difference between a usable family relationship genogram and one you have to regenerate.
One person, one sentence
“Michael (male, born 1974)”. Put names in the same spelling every time, and say “male”, “female” or “nonbinary” when the name does not make it obvious.
Name every relationship
Use plain words: married, divorced in 2015, separated, living together, adopted, twins, stepson. Mention which couple each child belongs to.
Add health history on purpose
Genogram health history goes next to the person: diabetes, asthma, heart disease or depression. Mention a pregnancy or miscarriage the same way.
Describe emotional bonds
“Emma is very close to Linda”, “conflict between Jake and Michael”, “Susan has cut off contact with her father”. Leave them out if they are not part of your assignment.
Say what you do not know
For adoption or unknown birth parents, write “birth father unknown” or “biological parents unknown”. The genogram maker draws an unknown symbol instead of inventing details.
Protect privacy
Use first names, initials or pseudonyms and only the health details you need. For client work, follow your agency’s rules and never paste identifying records.
Three-generation genogram for class, practice and family history
Most nursing, social work, counseling and psychology courses ask for a 3 generation genogram. A three generation genogram covers grandparents, parents and their siblings, and the student’s own generation. Describe all three rows, mark yourself as the index person and include a legend. Large families work too; a genogram example with 9 kids fits best in a 16:9 layout with short labels.
Most instructors also expect a short written analysis. Use the finished chart to point out repeated patterns such as illness, divorce or cutoffs across generations; the genogram maker draws the chart, the interpretation is yours.
Who uses an AI genogram maker
Students
Turn assignment notes into a three-generation family genogram for nursing, social work, counseling or psychology class.
Therapists and counselors
Sketch a Bowenian or systemic genogram from session notes to discuss patterns with a client or supervisor. Use pseudonyms and verify the result.
Teachers and family historians
Create illustrated family charts, community genogram examples and classroom slides without learning diagram software.
Writers and families
Map fictional families, family reunion handouts or a gift chart that shows how everyone is connected.
Check your genogram before you submit it
AI images can misspell a name or draw the wrong line. Spend a minute on this checklist before you hand in or share a chart from any genogram maker.
- Every person in your notes appears once, with the right name and years.
- Squares, circles and diamonds match each person’s gender.
- Children hang from the correct couple, oldest on the left.
- Marriage, divorce, living-together and adoption lines match your description.
- The legend explains every symbol and line that the chart uses.
If something is wrong, rewrite that sentence more explicitly and regenerate. The genogram maker creates an image, so small fixes cannot be edited in place.
Genogram maker pricing
Choose Fast, HD, Ultra HD or Studio, from 1 to 17 credits per genogram. HD, Ultra HD and Studio are for subscribers, and a larger option keeps small labels easier to read on a big family. You need to be signed in. If a generation fails, its credits are returned automatically. Results are saved to your generation history so you can download them again later.
See credit plansGenogram maker FAQ
Is a genogram the same as a family tree?
Not quite. A family tree records ancestry: who is descended from whom. A genogram uses the same layout but adds standardized symbols for relationships, health conditions and emotional bonds, so it can show patterns across generations. Use a family tree maker for genealogy and a genogram maker when patterns matter.
What do the squares and circles on a genogram mean?
Squares are males and circles are females. A diamond marks a person whose gender is unknown or nonbinary, an X inside a symbol means the person has died, and a double outline marks the index person. The symbols chart on this page shows the full set the genogram maker uses.
How is divorce shown on a genogram?
Divorce is two slashes across the line that joins the couple; one slash means separated. Write the year in your description, such as “divorced in 2015”, and the genogram maker adds it near the slashes.
Can I create a genogram with medical history?
Yes. Write each condition next to the person, such as “Linda (born 1951, diabetes)”. The genogram maker shades the symbol and labels the condition; the color-coded style highlights health history most clearly.
How do I show adoption or unknown birth parents?
Say “adopted” for the child and “birth parents unknown” for missing relatives. Adopted children are joined by a dashed line, and unknown people are drawn with a neutral symbol rather than invented names.
Is the genogram maker accurate enough for clinical records?
No. It creates a clear illustration for study, discussion and presentations. AI output can contain mistakes, so check every label, and use your organization’s approved software for formal clinical documentation.
Can I edit or export the genogram?
You download a PNG image that you can insert into Google Docs, Microsoft Word, slides or a printed handout. It is not an editable diagram file; to change something, update the description and generate again.
Is my family information private?
Your description is sent to the image model to draw the chart and is saved with the result in your generation history. Use pseudonyms or initials and leave out details you do not need, especially for client cases.
More ways to create with the same credits
AI Storybook Generator
Turn a family story into an illustrated picture book.
Create a Character
Design a reusable character for family stories or class projects.
AI Pet Portrait Generator
Add the family pet as an illustrated portrait.
90s Photo Generator
Recreate a nostalgic family snapshot from a photo or prompt.
Make your genogram in minutes
Describe three generations, choose a style and let the genogram maker draw the symbols, lines and legend. From 1 to 17 credits per genogram, returned automatically if generation fails.
Open the genogram maker